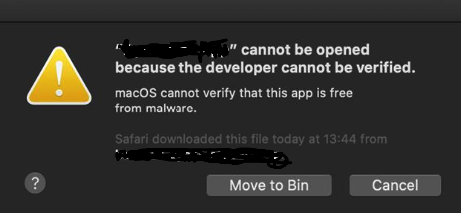
.app cannot be opened because developer cannot be verified.

Appium iOS Catalina app cannot be opened because the developer cannot be identified

When upgrading Appium or upgrading to Catalina you may start seeing an issue when running your tests whereby Appium can’t open your app. Instead you’ll see an alert / pop-up which says:

"YourApp.app" cannot be opened because the developer cannot be verified.

To resolve this:

Using terminal, cd to your .app folder then execute:

xattr -dr com.apple.quarantine DysonLink.app

Cucumber Best Practice

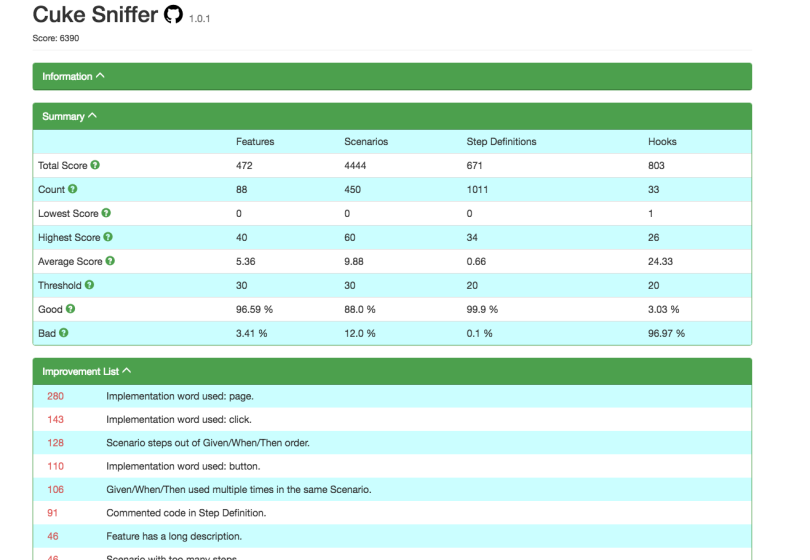
For those of you have difficulty understanding what a good cucumber suite looks like it might be worthwhile taking a look at the cuke_sniffer gem. It’s a neat gem that searches your cucumber project for smells and gives you not only a score but a detailed list of the smells and exactly where they are. […]

Coping with changing object id’s

Sometimes you might be running automation on more than one branch on code. For example, it’s pretty common to be running some smoke tests on the ‘Development’ or ‘Integration’ branch and also be running tests on ‘Master’. So how do you cope when an object’s id is set to one thing on one branch and another thing on another branch. Well it’s easy – here’s an example using calabash and also one using watir

If I have an input field with an id of “important_x01” and my tests reference the field in a method as follows:


//calabash example
def important_info_input
   query("* marked: 'important_x01'")
end

//watir example
def important_info_input
  @browser.text_field(id: 'important_x01')
end


Then let’s say that there is a change to that object id on the integration/development branch and it is now called “i_info”. So, until this change is promoted to Master this object will be known on different branches as two different things. Well the easy way to handle this is to allow the code to return whichever of these objects exists:

//calabash example
def import_info_input
 if element_exists("* marked: 'important_x01'")
    query("* marked: 'important_x01'")
 else
    query("* marked:' i_info'")
 end
end  

// watir example
def important_info_input
 if @browser.text_field(id: 'important_x01').exist?
   @browser.text_field(id: 'important_x01')
 else
   @browser.text_field(id: 'i_info')
 end
end


Why automation isn’t King!

Automation should be King in development but it’s not and that’s generally because the standard of a lot of the suites out there is poor and that is due to unrealistic expectations of the tool by those performing the automation.

Some companies have a thousand tests, but the tests are flaky and they perform really badly, they fail now and again and no-one knows why and no-one really cares and as a result the test suites are useless and no-one really believes that automation works.

Tools like Watir and Capybara are breeding grounds for these flaky tests. They provide a level of abstraction that insulates the new automation engineer from the level of subtlety that stable automation requires.

Their level of abstraction makes people think that they can just define some elements in a page class, write a scenario in a feature file and then use nothing but a bit of watir and rspec direct in the step_defintions like this:

site.my_area.my_page.my_checkbox.when_present.click
site.my_area.my_page.my_button.when_present.click
site.my_area.my_other_page.my_field_1.when_present.set('my_value')
site.my_area.my_other_page.my_button.when_present.click
expect(site.my_area.my_important_page.h2.text_,to_eq(some_value)

But I’ve got news for you, it doesn’t work like that! Not in real life. In real life you need to do some magic behind the scenes, because maybe you’ve got some javascript still loading, or maybe this page is really slow to load (and the performance is not going to get fixed) and maybe on your crap test environment the button even needs to be pressed twice to get it to load? So you need belt and braces for pretty much most things.

 For some elements you might find you need to fall back into Selenium commands; you’ll be doing everything you can to avoid using x-path as a locator; you might even need to fall back directly into javascript to interact with the DOM. You’ll probably need to add some robust error handling for when a page hasn’t loaded due to network issues; you’ll want to do set up and tear down of data; you’ll need to be thinking about what you’re verifying and why and what you should be verifying stuff against. You might be reading in copy text files for site verification or grabbing data from the CMS API; there is a whole world of stuff that you should be doing…you should be making your tests independant; flexible; extensible; reusable; performant; robust; and self-verifying.

So why are your tests failing?

  • Using brittle selectors such as x-path
  • Using fixed sleeps instead of enhanced waits
  • Using the same test data while running your tests concurrently
  • Not having error handling in your API calls
  • Badly written automation code – not taking care with each element
  • Making your tests too long
  • Not making your suite robust enough to handle network issues
  • Failing to version your tests causing the wrong tests to run against the wrong branches

If automation was as simple as banging out straight forward lines of Watir or Capybara then everyone would do it; they’d do it quickly and it would be cheap; but it’s not that simple. It requires consideration and design and most importantly it requires TESTING!

“Flaky test suites are sloppy. They are worse than no tests at all!!”

So next time you come across flaky test suites, disable those suites immediately and fix them so that they are no longer failing intermittently. If we all take care and we all do it right then people will see that automation does work and automation will be King.

Scenario Outline Madness

One of my pets hates is seeing test suites which perform really badly because of the overuse of the Scenario Outline construct.

Seriously, you need to think about why you are using them? Do you really need to run this entire scenario including the Background Steps (if you have them) all over again?

Here’s an example of where it is not required and how to change it:

Feature: Personal Details

Scenario Outline: Verify that a user is prevented from entering an invalid phone number

Given I am logged in

When I goto my personal details

And I enter an invalid  <telephone_number>

Then I see an <error_message>

Examples:

|telephone_number| error_message|

|abd|Please enter only numbers|

|12|Please enter a valid telephone number|

|44++ 22|Please enter a valid telephone number|

——————————

Now why would you want to re-login every time here? Why would you not do this:

Feature: Personal Detail

Scenario: Verify a user is prevented from entering an invalid phone number.

Given I am logged in

When I goto my personal details

Then on entering an invalid telephone number I see an error message :

|telephone_number| error_message|

|abd|Please enter only numbers|

|12|Please enter a valid telephone number|

|44++ 22|Please enter a valid telephone number|

——————————

I mean ok, I accept that two actions are included within one step i.e. edit the telephone number and verify the error message, but we have multiple actions in one step all the time …for example, ‘Given I am logged in’ often covers a whole host of actions e.g. visit the home page; click on login; visit the login page; enter your login details; submit your login details; verify that you’re logged in, so it’s fine – honestly it is!!

I can understand why people are reluctant to this, it down to semantics and the constraints people feel when using Gherkin, it’s those WHEN and THEN keywords, because naturally you’d want to say: “When I enter an invalid telephone number then I see an error message” and people are shit scared of that “then” right there in the middle and become convinced that there is no other way to write this test than as a Scenario Outline.

Just making this simple change to this test will make it run 3 times faster – remember, you’re not testing login here,  you are testing that the correct error message is displayed – therefore that is the only bit you need to re-run!!


So, when do you use a Scenario Outline?

So, when do you use Scenario Outline? Well, I believe it should only be used when you actually need to rerun the whole scenario. So, for example, let’s say that you want to check that a users details have persisted after logout, then you do actually need to re-run everything, so you do need to use a Scenario Outline.

Scenario Outline: User details have persisted after logout

Given I have logged in

And I have set my personal details <name>, <telephone_number>, <date_of_birth>

And then logged out

When I log back in

Then my personal details are still set to <name>, <telephone_number>, <date_of_birth>

Examples:

|name|telephone_number|date_of_birth|

|John|0772219999|18/01/1990|

|Jo|077221991|19/02/1991|

——————————


API-Mock-Server Rackup error

Just a quick tip…if you are trying to rackup an API-Mock-Server and you get either of these errors:

"Could not connect to any node", "Could not connect to any secondary or primary nodes"

The chances are that you’ve forgotten to start mongodb! So start it up:

brew services start mongodb

Note this assumes that you’ve installed mongodb with brew.

Calabash Android HTC One M8 issues

I find it interesting to see how different phones handle calabash tests. For example a smoke test which runs in 12 minutes on a Samsung Galaxy S4 Mini might take 20 minutes on an HTC One M8…but this doesn’t make any odds to the overall test suite as all the test are running in parallel anyway…what does cause issues though is the HTC one M8’s inability to sometimes capture the first touch event.

On  normal day my automation suites will run about 30-40 jobs. These tests are really really stable…and if they fail then we can be sure that the developer has introduced or bug or very very infrequently has caused an unexpected automation breaking change. However, this wasn’t always the case. All of the jobs were stable from the get go with the exception of anything that ran on the HTC M8 One – that phone is the pits!!

Here are the issues I encountered and how I resolved them:

  1. The HTC M8 suffered with timeouts via the app from services when other phones didn’t
  2. The HTC M8 took longer to display objects on screens than other devices
  3. The HTC M8 suffered with random failures at the start of scenarios

To resolve this I did the following:

  1. Built in retries at the screen level when the ‘services can’t be reached’ msg was detected in the app using an appropriate back-off protocol of i.e. 1,2,4,8,16,32,64 seconds
  2. Made sure to set a timeout of 30 seconds on problematic screens e.g.
    wait_for_element_exists (element_name, :timeout => 30)
  3. Utilised the cucumber rerun command in the jenkins job to rerun any failing scenarios e.g.
     --format rerun --out rerun.txt
  4. Sent an adb command to the device to ensure it was properly awake and didn’t have the dimmed screen:
    # Sends a command via adb to the current device to press the Enter key
    system("#{default_device.adb_command} shell input keyevent KEYCODE_ENTER")
    

    This was enough to undim the screen and make the phone ready to accept the first touch event.

For interests sake here are some times for the same suite of tests running on different devices. I would be interested to know if others experience the same differences and what causes the performance to be so radically different between Kitkat and Lollipop and then between the Samsung Galaxies and the Nexus / HTC One?

Vodafone 890N on Kitkat => 12 mins
Galaxy S4 mini on Kitkat => 12 mins
Galaxy S5 on Lollipop => 16 mins
Galaxy S6 on Lollipop => 17 mins
Nexus 6 on Lollipop => 20 mins
HTC M8 One on Lollipop => 23 mins

Cannot see Android device via ADB

So, the plug came out of the back of the CI server…and at the same time 2 of the Samsung phones upgraded themselves and I had switched from one usb hub to another and replaced the usb cables….and suddenly I couldn’t see the Samsung S4 mini or the Samsung S5 via adb and all my calabash automation tests in jenkins were failing and the world was collapsing around my ears…for at least an hour! Was it the hub, the cables, the restart, the upgrade?

After a good 15 minutes stopping and restarting adb and plugging and unplugging cables I decided that it must be something to do with the new ports I was using…so I ran:

$ lsusb

and could see the devices connected – so the usb ports were working.

So then I ran :

$ ls -l dev/bus/usb/001

and for some reason plugdev was only showing for one of the devices through adb write permissions were missing:

crw-rw-r--  1 root root    189, 128 Apr  8 11:46 001
crw-rw-r--  1 root root    189, 129 Apr  8 11:46 002
crw-rw-rw-+ 1 root plugdev 189, 135 Apr  8 16:59 008
crw-rw----+ 1 root audio   189, 137 Apr  8 16:16 010


So, what had changed…I checked my android.rules file; checked that ubuntu hadn’t upgraded after the restart and then double checked the phones where I discovered a new informational message…’connected as a media device’!!

Well, somehow both samsungs had connected as Media Devices when they restarted and they need to be connected as Camera devices – so I changed both phone to connect as a Camera device and as soon as I made the change I could see them when i ran

$ adb devices

and all my jenkins jobs were able to run again.


Calabash (RunLoop::Xcrun::TimeoutError)

While I remember, for those of you with older macs who keep encountering the dreaded timeout error when running calabash ios against the simulator:

 Xcrun timed out after 30.27 seconds executing
   xcrun instruments -s templates
  with a timeout of 30
   (RunLoop::Xcrun::TimeoutError)
  ./features/ios/support/01_launch.rb:27:in `Before'

You can change the default RunLoop timeout by adding a override in your support/env.rb file. For example to increase the timeout to 150 seconds, add this:

RunLoop::Xcrun::DEFAULT_OPTIONS[:timeout] = 150

Give it a try!!!


—–UPDATE—–

Note: RunLoop errors using calabash-ios are the most frustrating errors to debug when using physical devices. Sometimes there are other issues which cause this error, such as

A) Forgetting to put the calabash ios server in the ipa;

B) Having a typo in the one of the environment variables (BUNDLE_ID, DEVICE_TARGET, DEVICE_ENDPOINT).

C) Not having the device enabled for development

If you encounter RunLoop errors and you can’t understand why …and you are sure that it’s not one of the first 3 reasons then:

  1. Check UIAutomation is set to ON on the device and that you don’t have an iOS update alert on your screen
  2. If the Developer row is missing or UIAutomation is already turned on, try the remaining steps. If there is an IOS update alert, do the update or delete it (note it will download again and you will have the same issue unless you block apple updates in your router – if you want to do this then google it)
  3. Unplug your device
  4. Plug it into a different computer
  5. Open Xcode and view Devices
  6. Ensure there is no yellow warning triangle, if there is then allow xcode to copy the symbol files across to your device
  7. Open Instruments and try to record a session using the device
  8. Unplug the device
  9. Restart the device
  10. Ensure the Developer row is present in settings and that UI automation is turned on
  11. Plug back into your original machine
  12. Open Xcode – check for yellow triangle and repeat symbol copying (or you might need to update xcode – xcode will tell you)
  13. Open instruments and try to record
  14. Set UIAutomation to ON again
  15. Retry your tests.

Note that this is process that you may find yourself going through everytime you either update xcode, your device iOS version, switch machines, plug a new device into your CI…get used to going through this ritual if you are in charge of an iOS device library!!

See cucumber scenarios by tag – solution

I was complaining the other day that I couldn’t find a little utility which would allow me to see my cucumber scenarios by tag so I wrote one.

I’m just about to put it up on GitHub and I’ll package it as a gem as well then add the link to it from this site.

Basically, it’s as simple as providing the directory for your feature files; a filename for the output and the tagname that you want to search for:

dir = '/Users/user/GitHub/my-calabash/features/'
filename = 'tag_info_out.html'
tagname = '@manual'
generate_report(dir, filename, tagname)

and then it presents the results in an html file:

report

Ok- so the formatting leaves a lot to be desired and I will work on improving that, but it’s so handy to be able to just input a tagname and then get a report of all the scenarios that would be called using that tagname.

The next incarnation will produce a report for multiple / concatenated tagnames.